
If you’re like a lot of groups using OpenSports, you are running a business or growing a non-profit, trying to increase revenue, and that means you need to keep up with the important metrics! Group admins can view reports about events, members, discounts, and payments (reports are available on the web only).
View things like:
- newest members to join your group,
- number of events each member has gone to,
- no-shows, and
- total dollars collected per the event!
Ps… Yes! You can export these reports too!
Reports and metrics you have access to
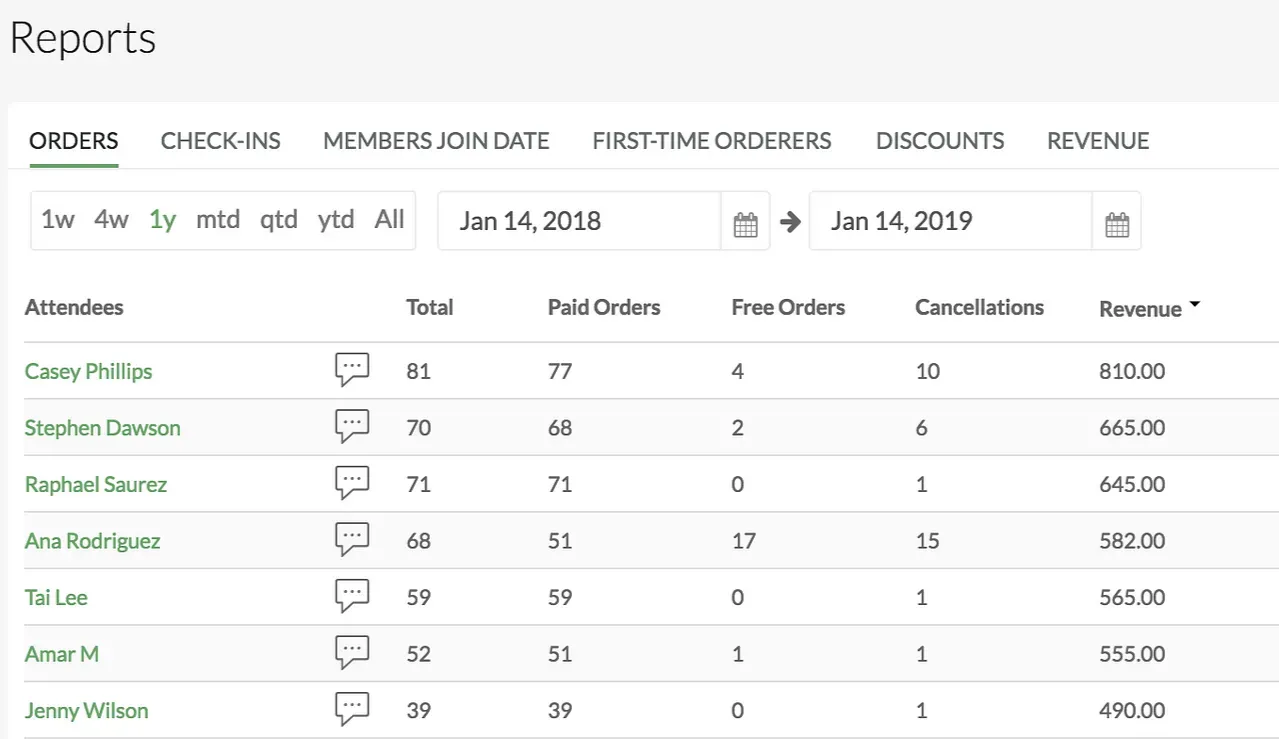
1. Orders
Easily view how many paid and free events players have been to, who has been to the most events over a chosen period of time, and who has cancelled their RSVP a lot.
Note: The “Total” column excludes games cancelled, however revenue could include cancellations if someone didn’t cancel by refund deadline
Other ways you can use this information:
- View who has joined the most games and who routinely cancels
- Award exclusive offers / discounts to people who hit a certain number of events (i.e., players who hit 100 paid events get a free game!)
- See how much revenue individual players bring in, and use that data to make projections
- Ban repeat cancellers from your group
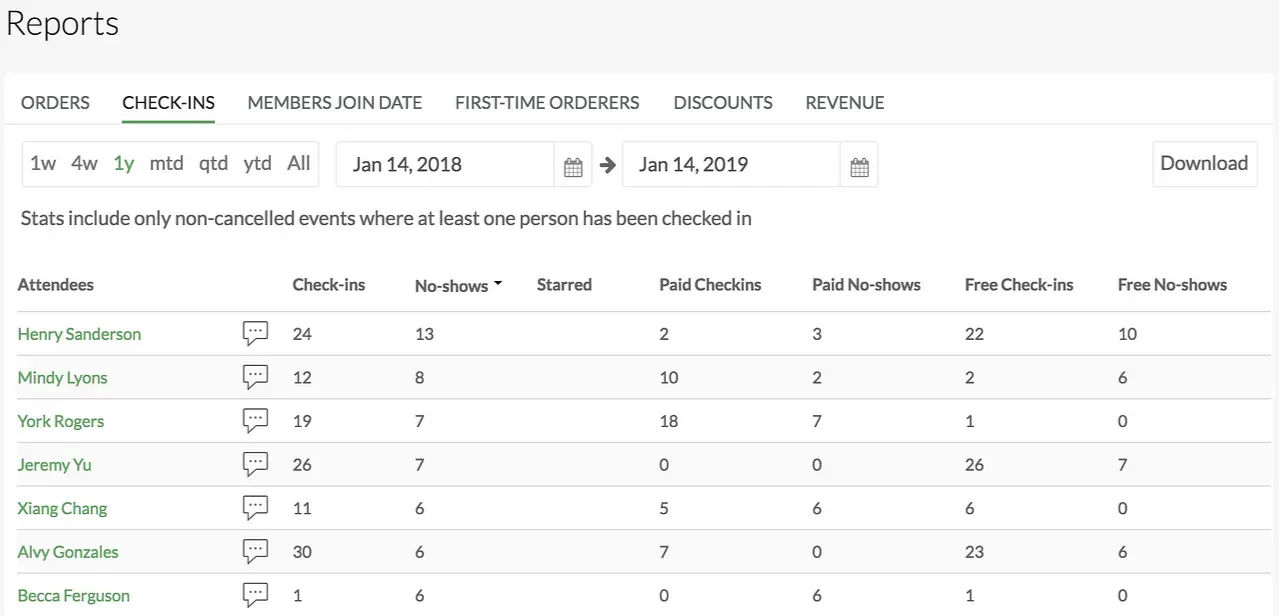
2. Check-ins/No-shows:
Easily sort and filter by the various columns to see who has been to the most events in a given period of time, month or the all time record holder.
Other ways you can use this information:
- Award exclusive offers / discounts to people who hit a certain number of events (i.e., players who hit 100 events get a free game!)
- Ban repeat no-shows from your group
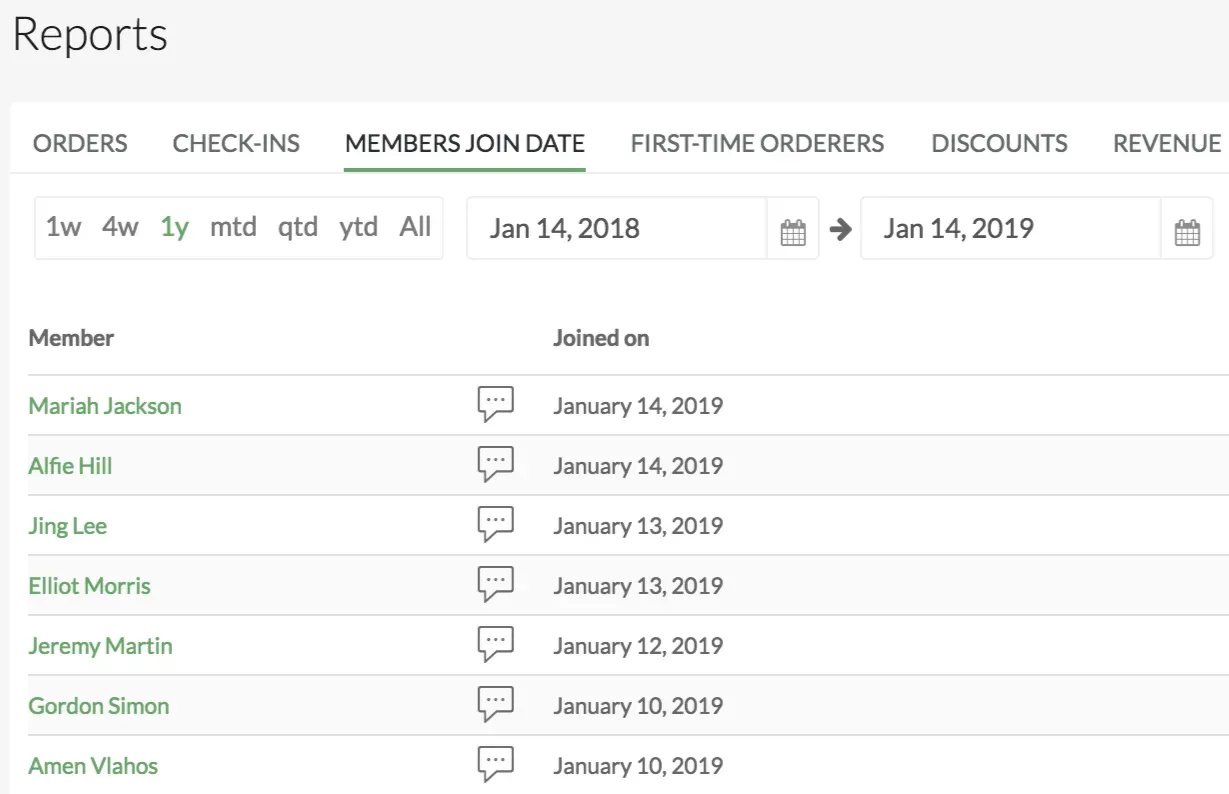
3. Member Join Dates
View who your newest group members are, and how many members joined your group within a specific period of time.
Other ways you can use this information:
- Send new players a welcome message or a discount when they join your group!
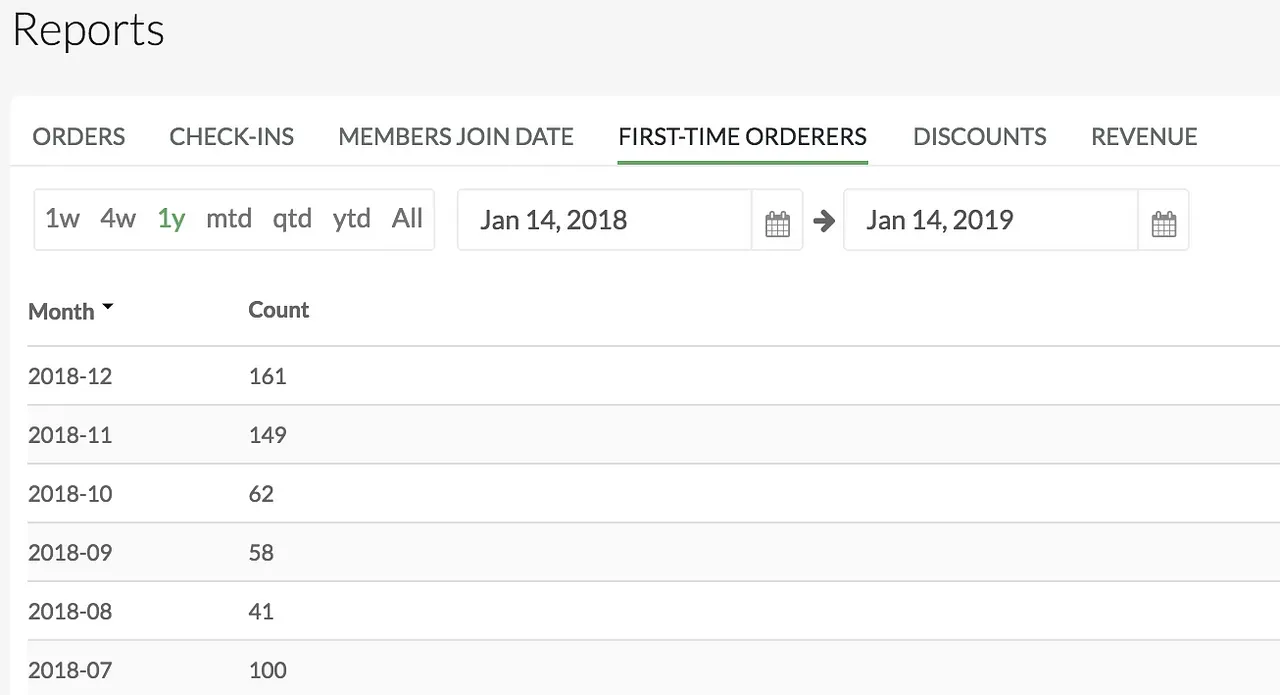
4. First Time Orderers
Ensure your group is growing by keeping tabs on the number of new players making their first orders on a month over month basis.
In the example below, you can see that in December 2018, 161 players have made a first-time order, and in November 2018, 149 have. Keep track of these metrics to make sure you have growth in the number of new people joining games, every month!
Other ways you can use this information:
- Use “Number of First-time Orderers” as a metric to gauge your group’s reach to new players
- View the month(s) when you had the largest growth in first- time orders and repeat whichever marketing tactics you used to reach that!
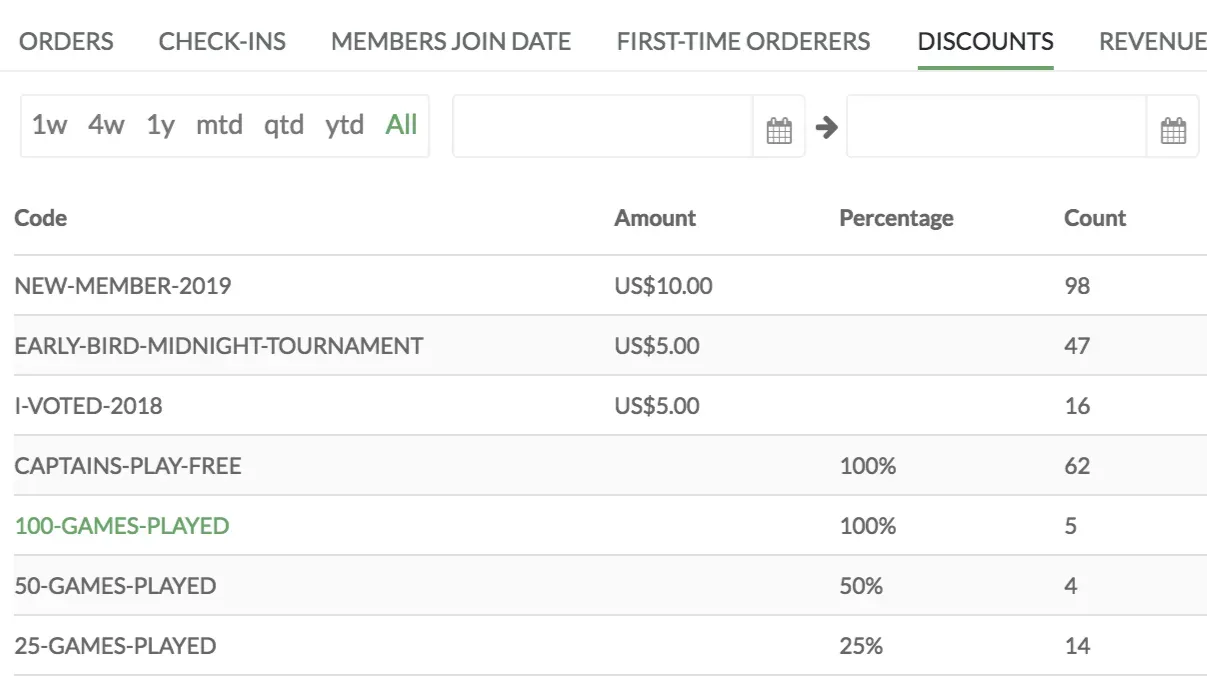
5. Discounts Reports
View how many players have used each discount that you set up!
In the example below, you can see that the organizer created a “New Member 2019” Discount which gives new members $10.00 off their first game, and 98 players have redeemed that discount since it was created.
Note: There is an Amount column and a Percentage column, because when setting up discounts you can set up a fixed value amount (i.e., $5 off), or a percentage (i.e., 50% off).
Other ways you can use this information:
- track how many times your captains/pickup organizers have joined events with their discount
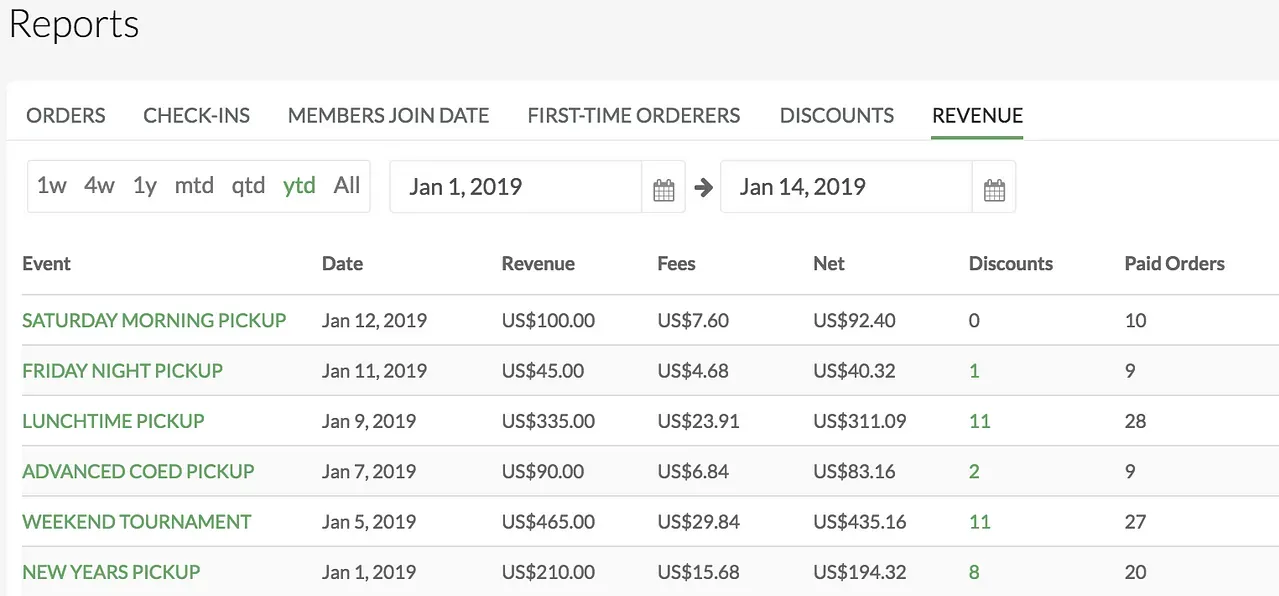
6. Payment Reports
Reconcile your finances and see how much money you are earning for each event, and how much money you’ve earned for all events within a specified period of time!
In the example below, the New Years Pickup event generated US $210 in revenue (gross, and including refunds) and $194.32 after transaction fees. There were 20 paid RSVP’s and 8 discounts were redeemed.
Anything in Green can be clicked and expanded, so clicking on “NEW YEARS PICKUP” brings you back to the event, allowing you to view the attendees list, and clicking on the “8” under Discounts shows you who redeemed a discount, and which discount they redeemed.
Why Reports?
Starting to tap into analytics will better help you understand your members and how actively engaged they are with your group.
With this data, you can warm up new users with a discount; Create loyalty programs and reward your most active players; Reach out to members who never come to events; Ban frequent no-shows… The options are endless and we can’t wait to see what creative things you come up with!
Let us know what types of questions you’d like answered by our reports.
We can’t wait to hear about how this feature helps groups continue to grow! Enjoy!
❤ Your friends,
The OpenSports team
Questions? Send them our way: support@opensports.net